Real Estate Analysis
Summary
At the beginning of 2022, the real estate market was volatile in Hungary due to unexpected events in Europe. An ongoing price increase was present in January and February, however, the Russian aggression and the political environment in Hungary have brought uncertainty into the housing market. This project was developed to see and predict trends in real estate prices and identify whether it was a buyer's or seller's market to support decision-making in pricing and when to enter the market.
Collecting Data
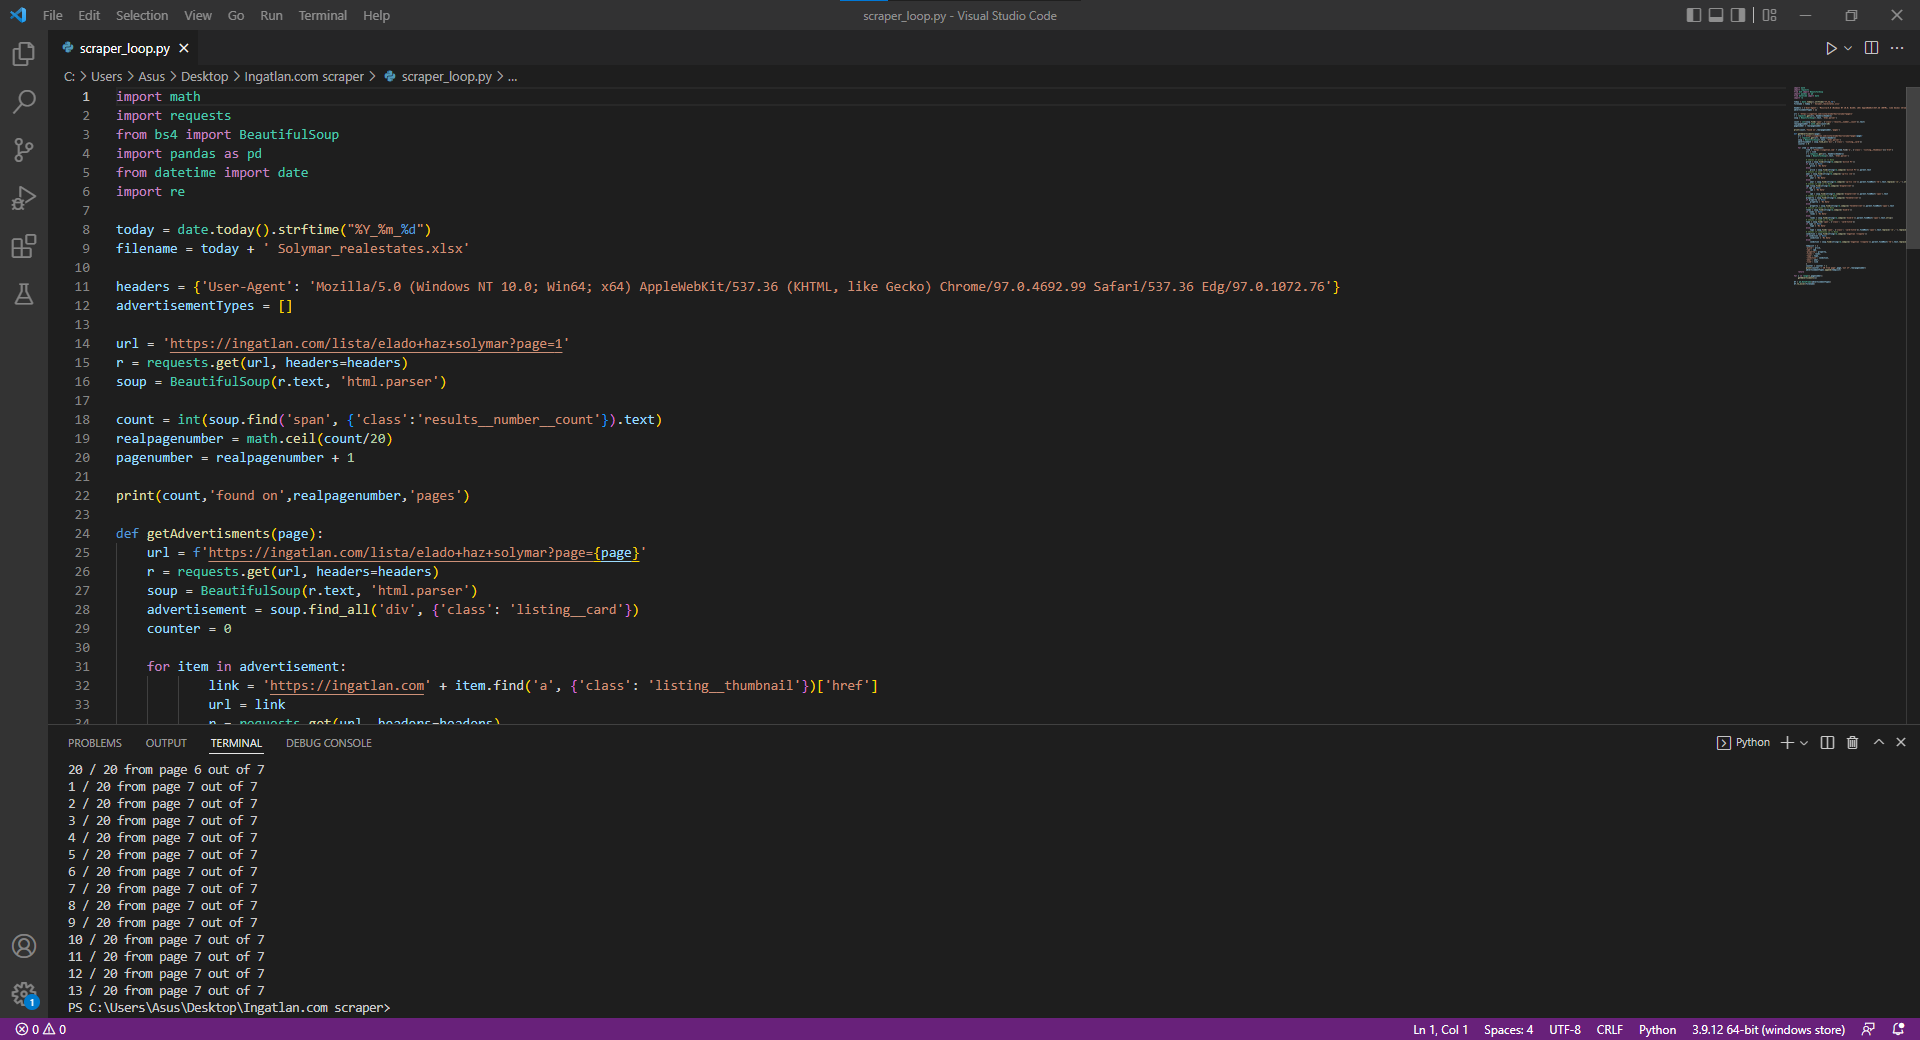
Complete and accurate data is crucial to precisely analyze, visualize and predict trends. Therefore, data was collected from the most popular real estate website in Hungary with Python.
After analyzing realestatehungary.hu website's HTML structure and identifying the tags that held the key information, Beautiful Soup Python library was used for parsing and extracting data. The code found the advertisements based on the search criteria and logged the number of results in the terminal and automatically ran and parsed the data from the pages one by one. The code made it possible the follow the progress through the terminal as it logged the processed pages. Another Python library, Pandas was used to organize data into tables with headers and save it with the current date as the file name.
Python and libraries such as Beautiful Soup and Pandas made it possible to automatically collect and save data in a CSV file, ready for analysis.
Transforming Data
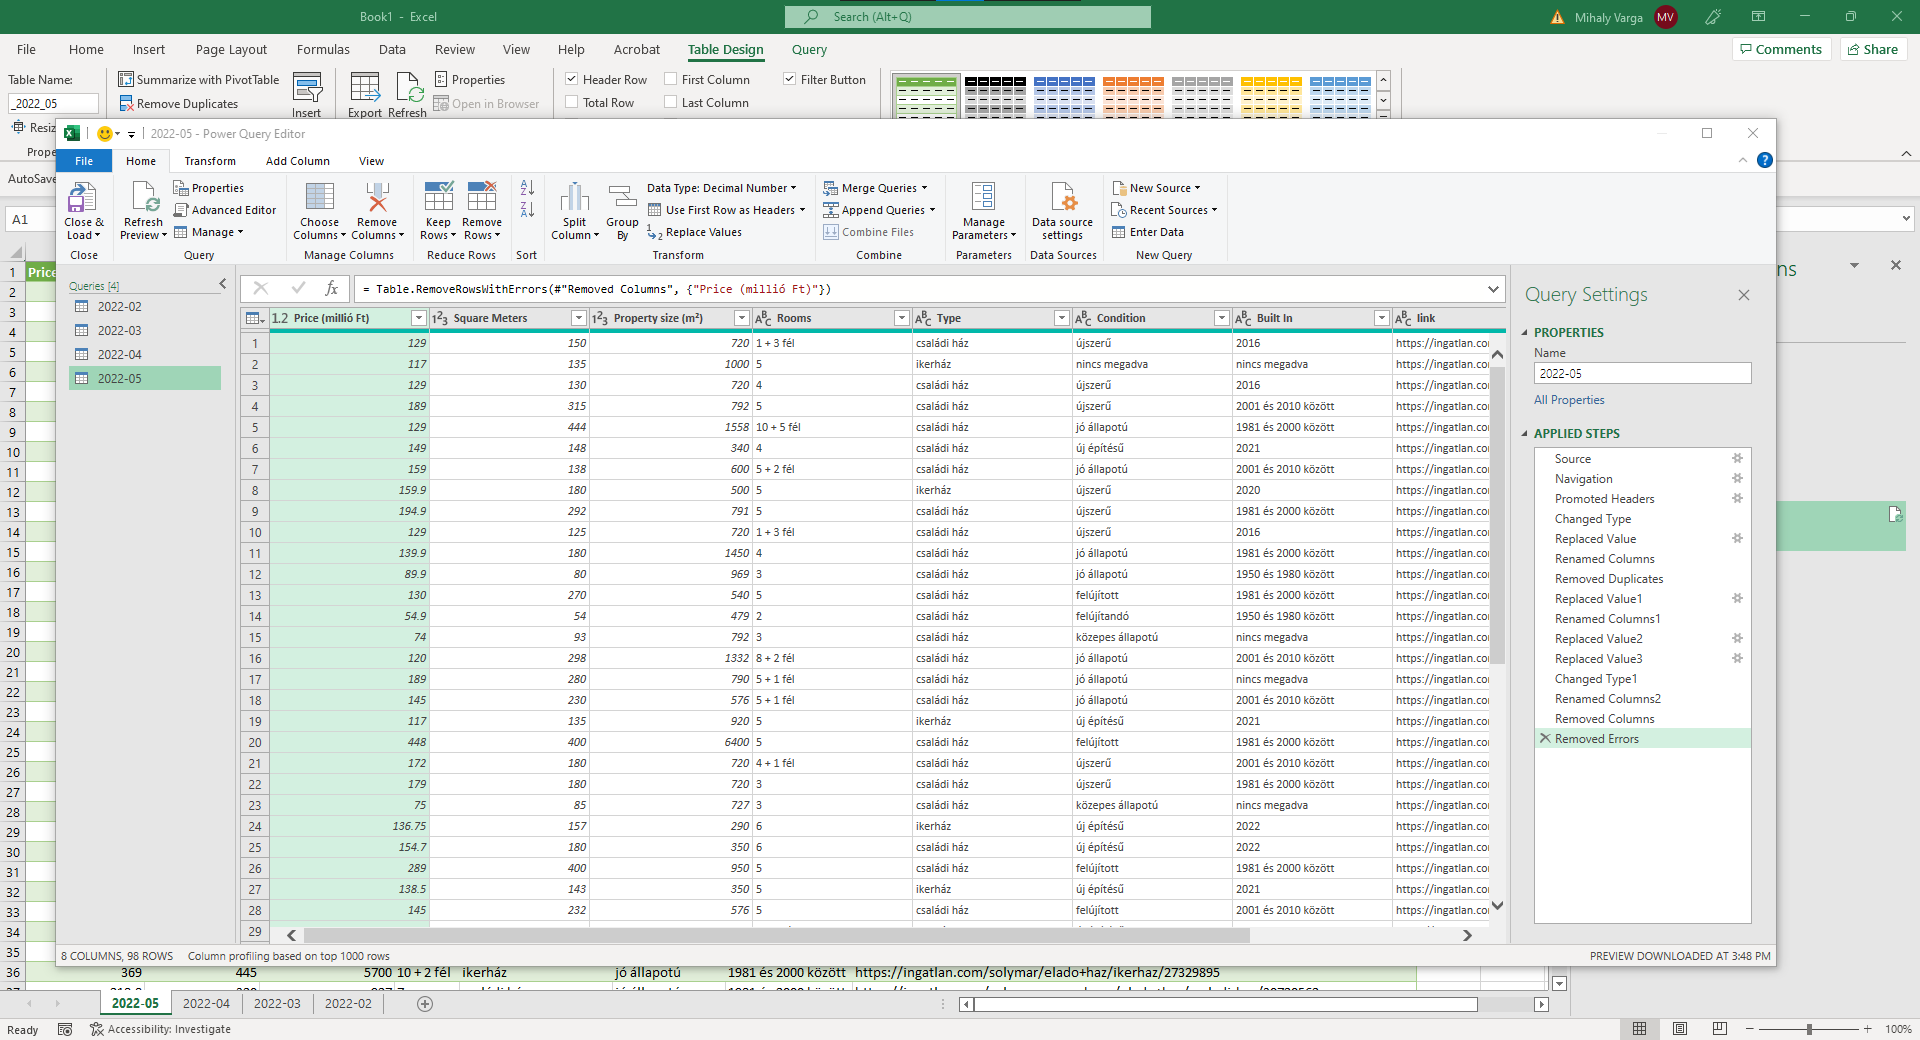
To have the data available for later usage and simple manipulation, the csv files were imported into Excel using Power Query to automate the process and clean the data from empty fields or spelling errors extracted from the website. Power Query cleaned and organized data into unified tables and sheets to avoid discrepancies, whenever a new csv file was available in the directory.
The data was ready for analyzing and visualizing after Power Query cleaned and organized the csv files into one Excel file.
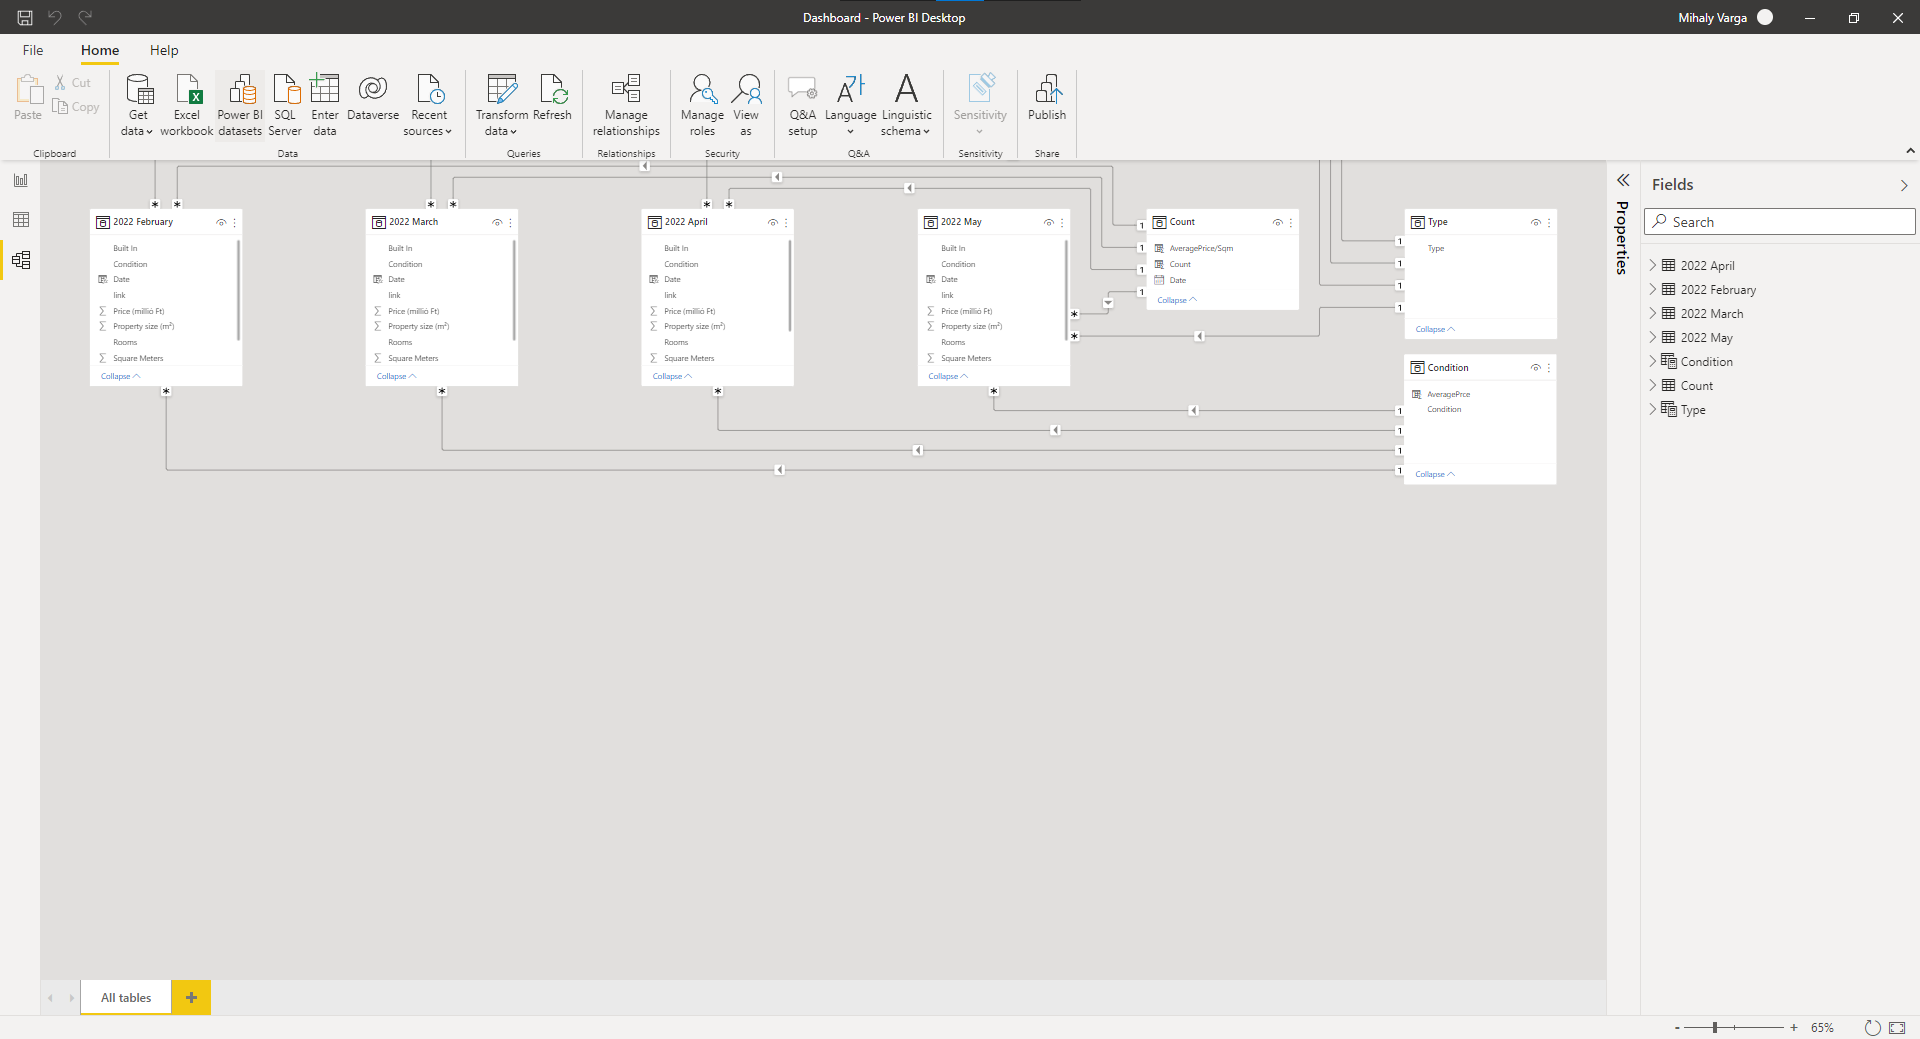
Visualizing Data
The data was imported into Power BI to visualize key insights and be able to filter and focus on certain areas with a dashboard. To enable this feature, additional data analysis expressions (DAX) were necessary to build formulas and relations between the sheets. When the data was ready, visuals were chosen to communicate findings in a simple, easy-to-understand form showing the required information such as average price, average price / square meter and the number of houses on the market.